Section 5 Results
This study focuses on three different academic terms consisting of 346 students across 11 different sections with five different instructors. The students studied were considered regardless of whether they had previously attempted College Algebra. The author is the only instructor who utilized the SBG method in the college algebra course. The studied population is presented in two groups: the students who were assessed using a traditional WAG method (136 total students) and those who were assessed using the SBG method (210 total students). The grade distributions of these two groups are shown in Figure 5.1.

The p-value for the difference between the pass rates of the two groups was found to be \(0.40\text{.}\) The \(95\%\) confidence interval around the pass rate difference of \(4.63\%\) is \(\pm 10.7\%\text{.}\)
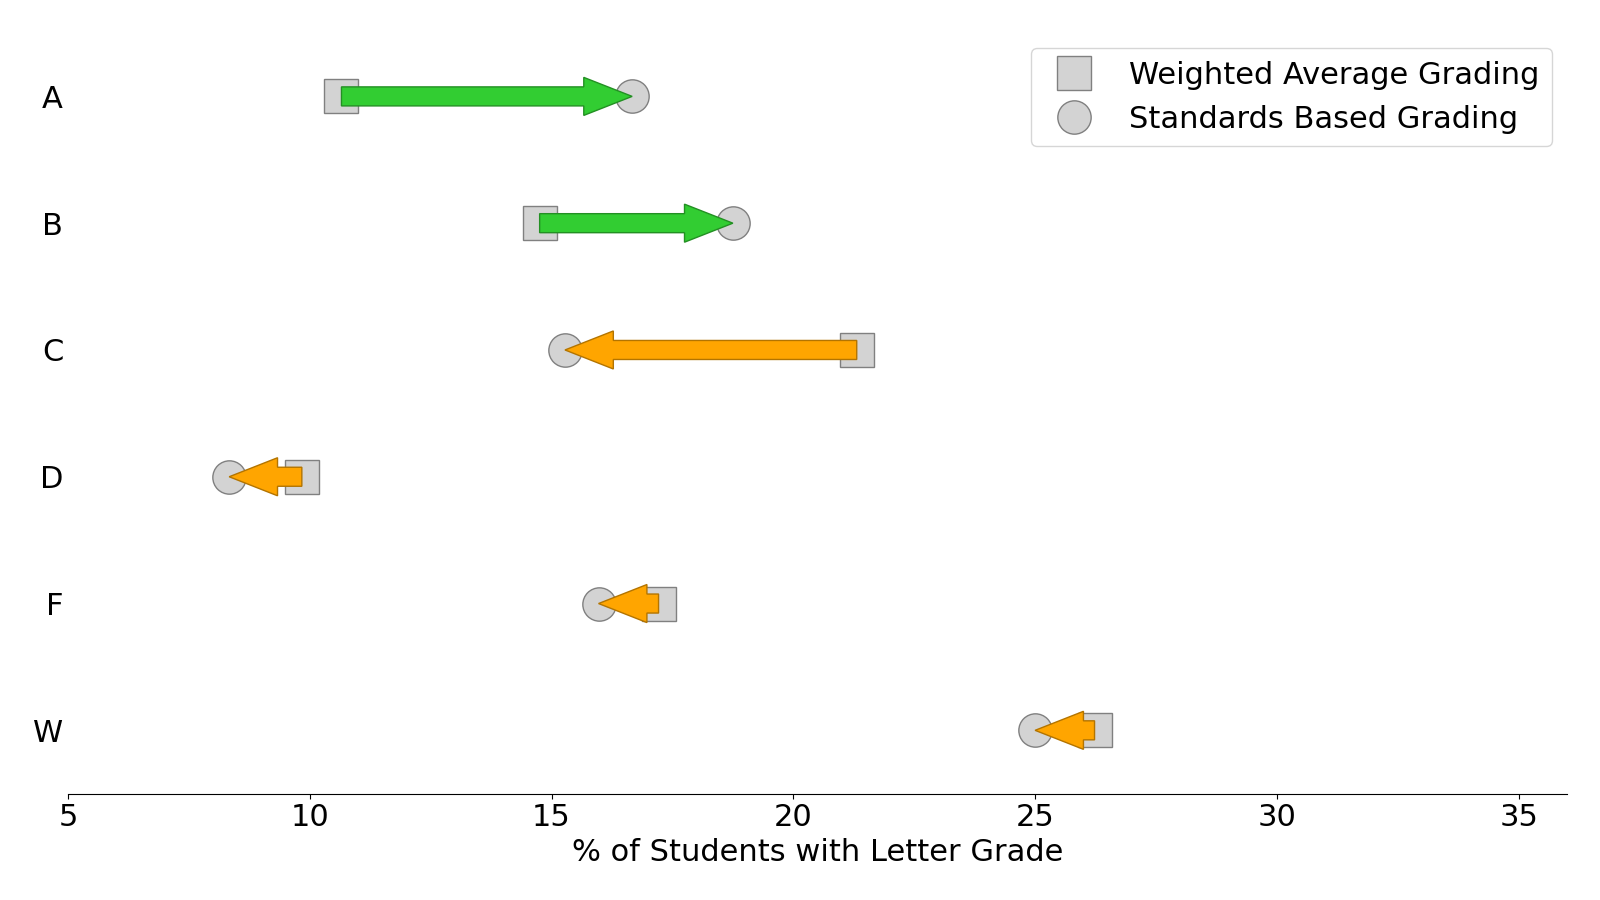
Shown in Figure 5.2 are the percentage values presented in Figure 5.1 and the comparison between the two different assessment methods. The green arrows represent an increased percentage of a specific letter grade from the WAG method. The orange arrows represent a decreased percentage of a specific letter grade from the WAG method.
This study also investigated the outcomes of future math courses of the two groups of students. Of the 346 students who took College Algebra in the studied terms, 266 students had taken a follow-up math course at the time of the study’s analysis. These follow-up math courses consisted of various courses, including College Algebra, College Trigonometry, and Pre-Calculus. The grade distributions of the two groups of students in their follow-up math course are shown below in Figure 5.3.

The p-value for the difference between the pass rates of the two groups was found to be \(0.52\text{.}\) The \(95\%\) confidence interval around the pass rate difference of \(3.97\%\) is \(\pm 12.0\%\text{.}\)
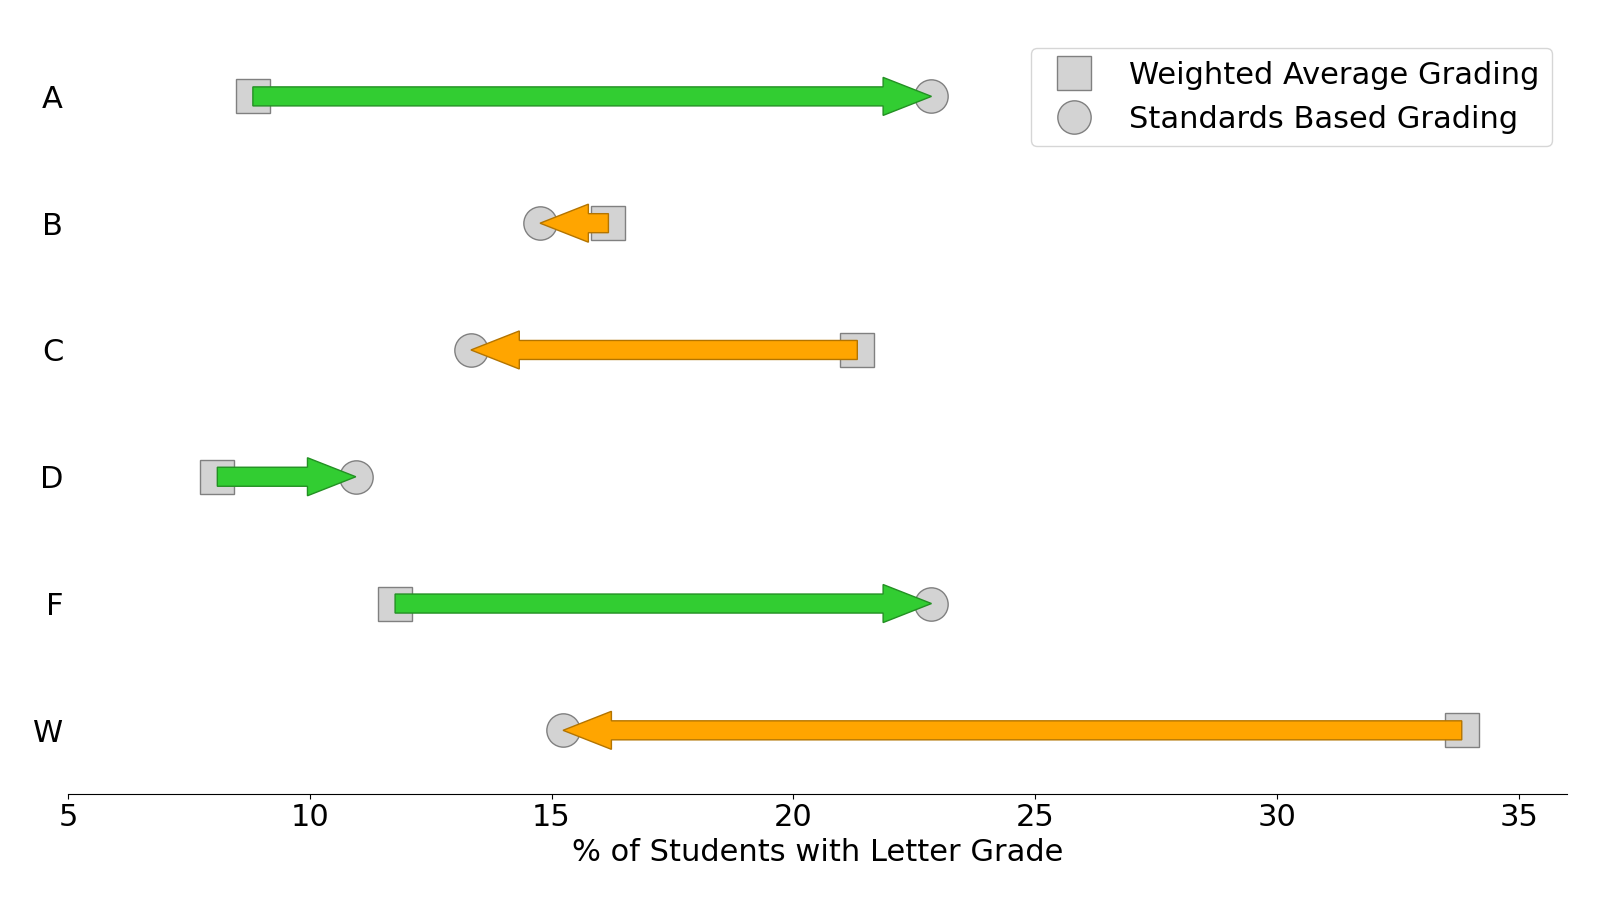
Shown in Figure 5.4 are the percentage values presented in Figure 5.3 and the comparison between the two different assessment methods. The green arrows represent an increased percentage of a specific letter grade from the WAG method. The orange arrows represent a decreased percentage of a specific letter grade from the WAG method.